Once your campaigns are live, the Campaign Dashboard is where you measure what's working and what needs fixing. This guide walks you through each section so you know exactly what to look at and why.
Prerequisites
- At least one active campaign running in SalesMind AI
- Access to the Campaign Dashboard (left nav → Campaigns → select a campaign)
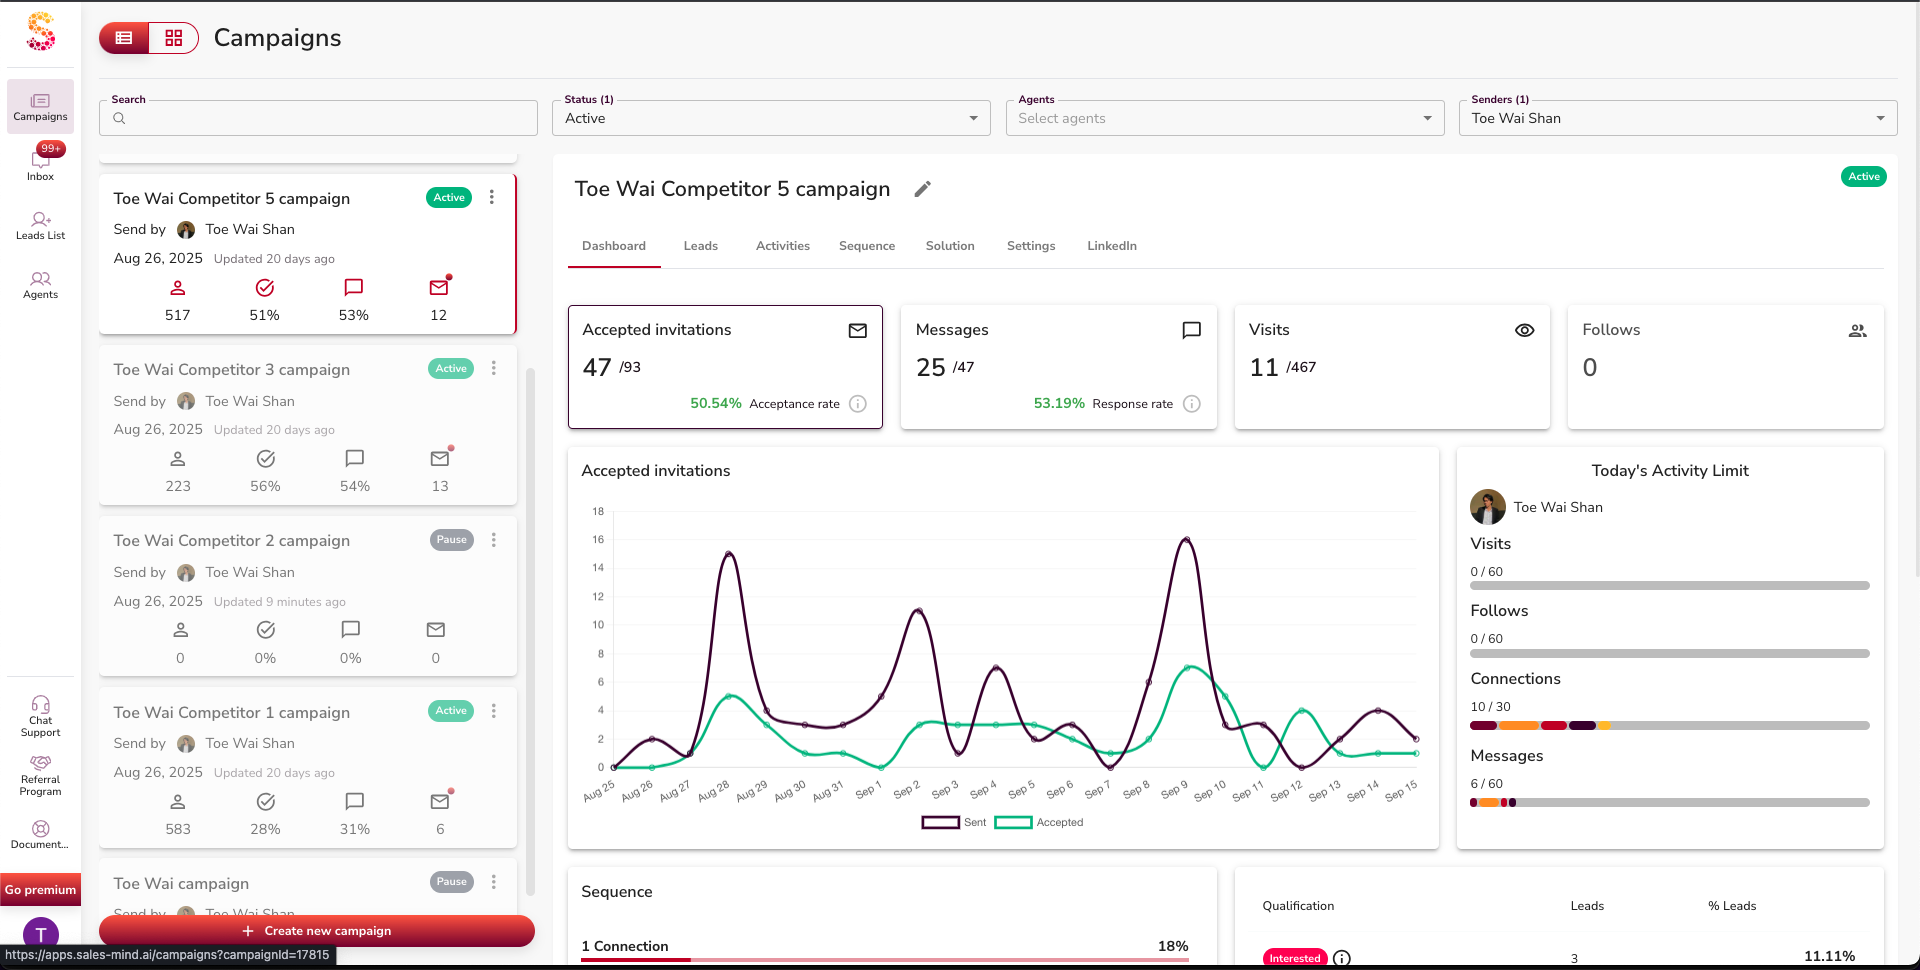
Step 1: Check Invitations and Acceptance Rate
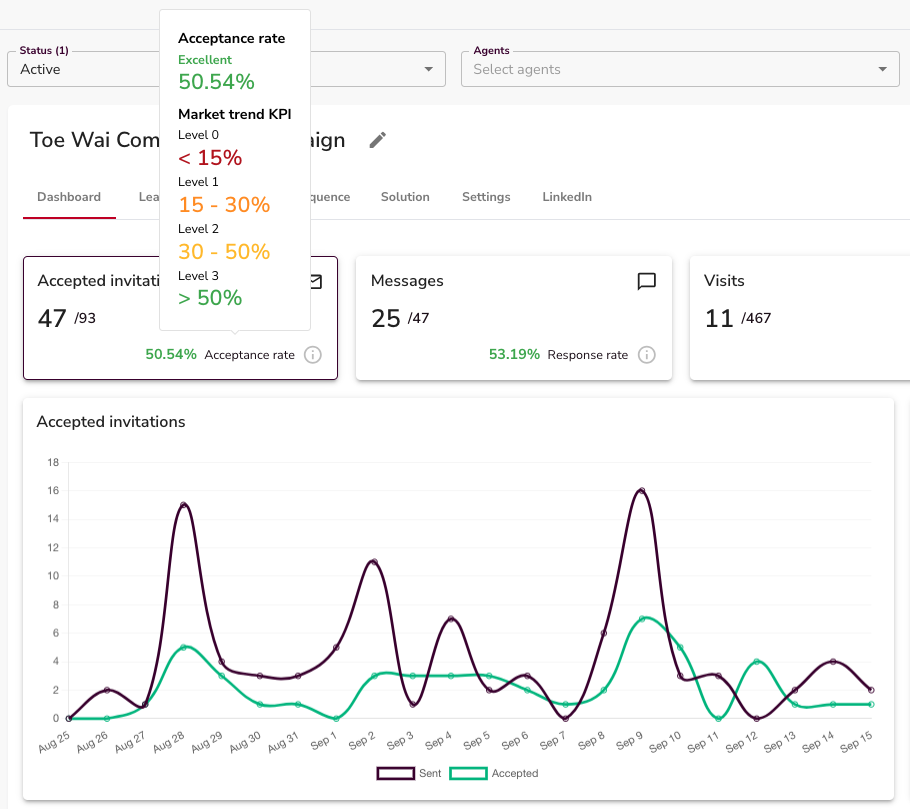
The first number to check is your acceptance rate — how many of your connection requests were accepted.
- Invitations Sent: Total connection requests sent
- Invitations Accepted: How many prospects connected back
What the numbers mean:
| Rate | Signal |
|---|---|
| Above 50% | Excellent — targeting and profile are working |
| 30–50% | Decent, but worth testing new messaging or audiences |
| Below 30% | Red flag — review your targeting, profile, or connection note |
⚠️ Warning: If acceptance drops below 30%, pause and diagnose before sending more invitations. Sending at scale with a low acceptance rate wastes your daily quota.
Step 2: Review Messaging Activity
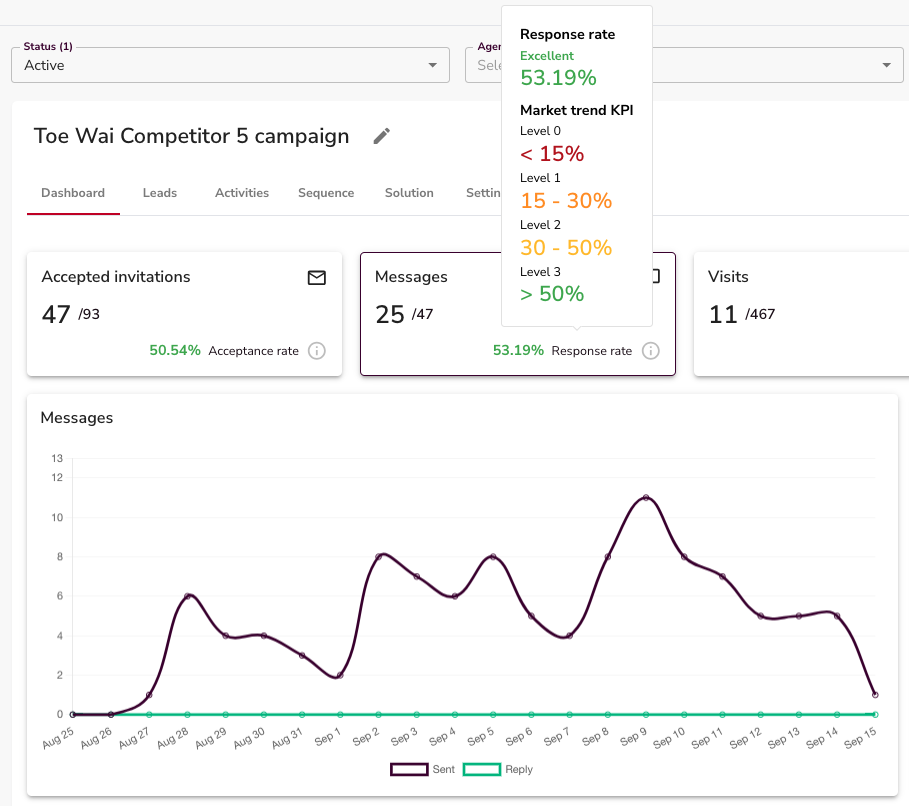
Your dashboard shows daily messaging stats:
- Messages Sent: Total delivered messages for the day
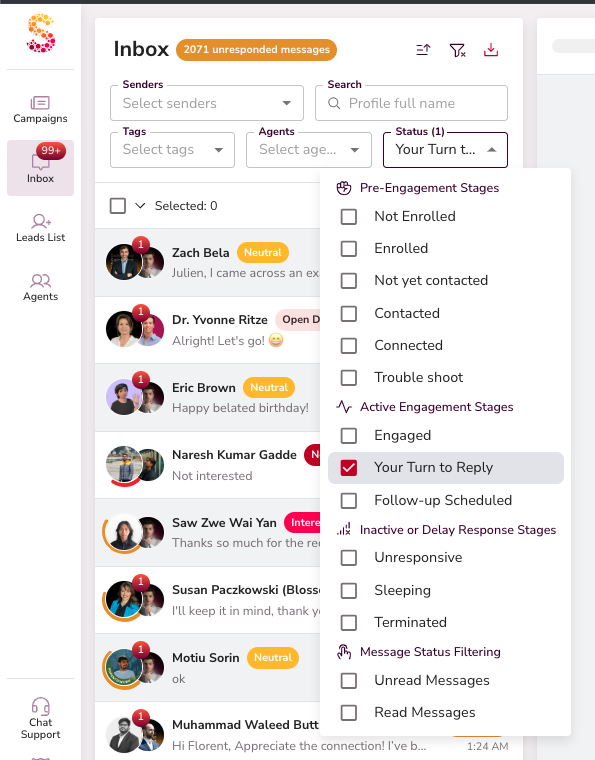
- Replies Received: Daily responses, visualised on a graph
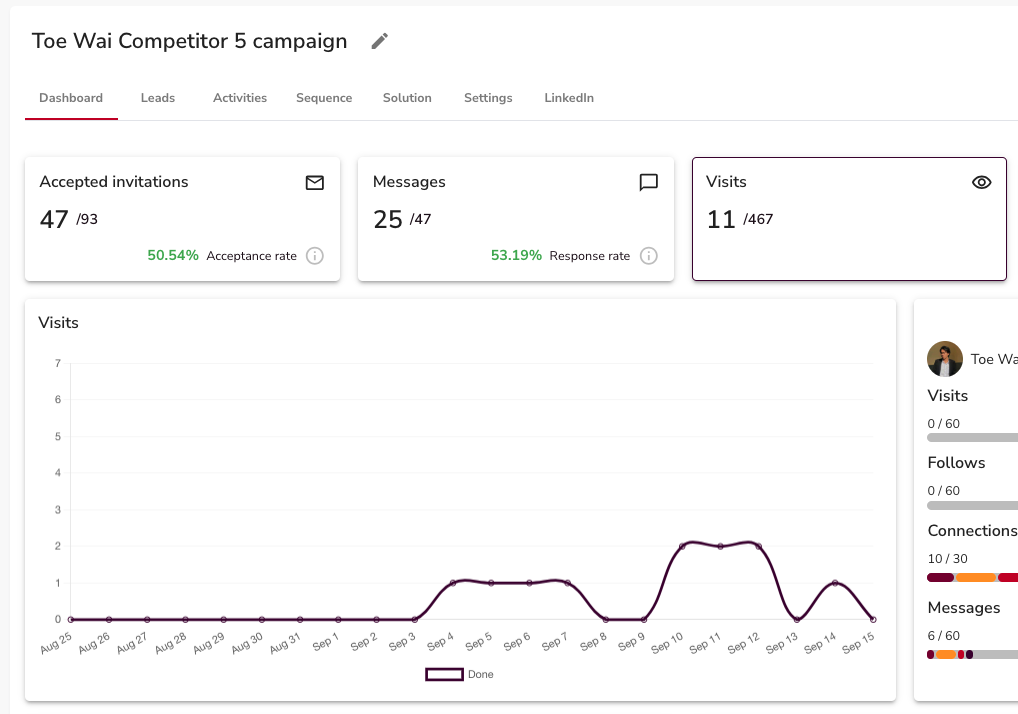
- Visits Scheduled: Prospects who haven't replied and haven't been excluded yet
👉 Note: Prospects who reply or are already in another campaign are automatically removed from the sequence. This keeps your funnel clean without any manual work.
Step 3: Understand Sequence Completion
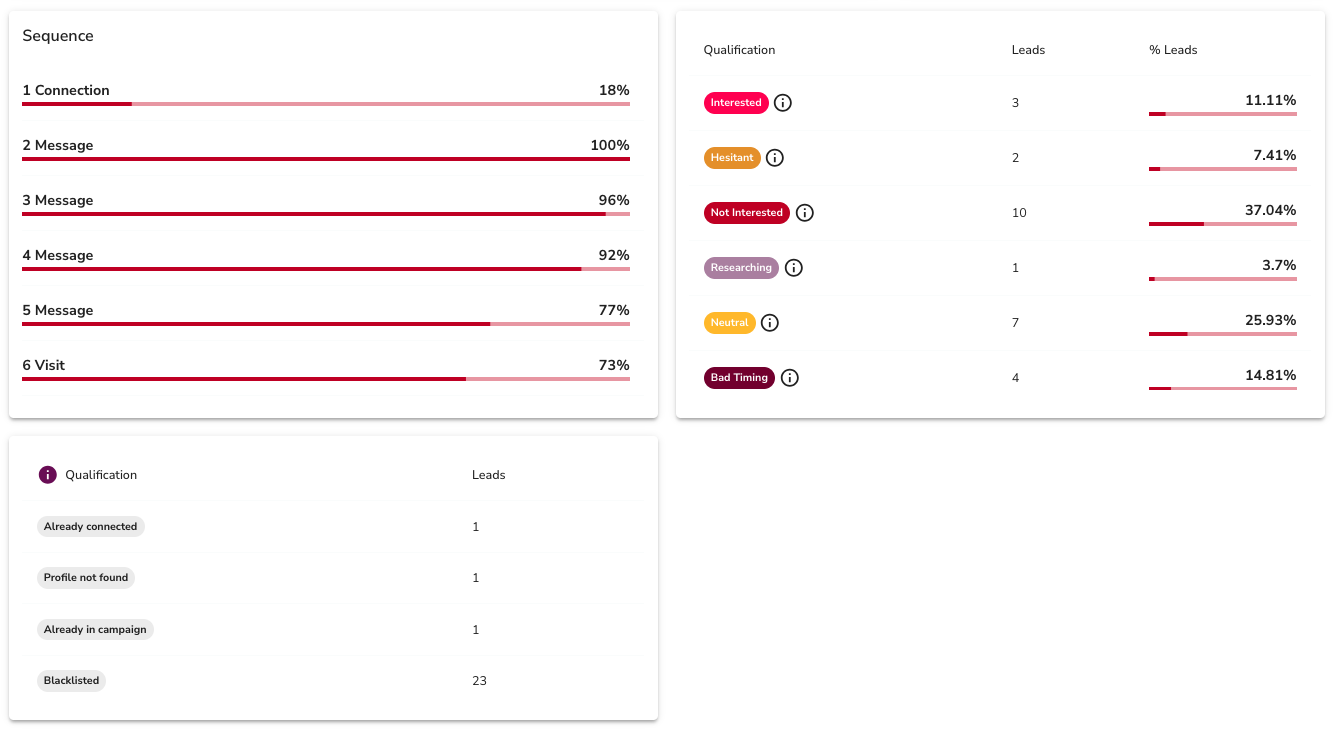
SalesMind AI automatically manages who continues through your sequence:
- Already-connected contacts are skipped
- Prospects active in other campaigns are excluded
- Any reply stops automated follow-ups for that contact
This means your sequence only runs on prospects who genuinely haven't heard from you yet.
Step 4: Track AI Reply Classifications
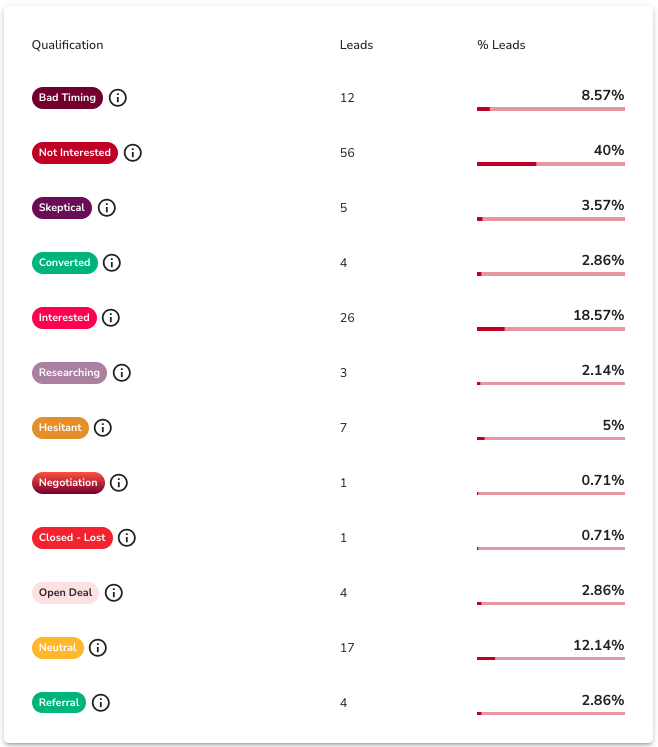
Every reply gets automatically tagged by the AI. The classification labels are:
Positive signals: Interested, Researching, Open Deal, Referral, Converted
Neutral/negative signals: Neutral, Bad Timing, Skeptical, Hesitant, Not Interested, Negotiation, Closed - Lost
Healthy benchmarks to aim for:
- Acceptance rate: 30%+
- Interested tags: 25–35% of replies
- Conversions: 2–7% (varies by offer and CRM data)
💡 Tip: Sort by "Interested" and "Researching" tags first. These are your warmest leads and deserve a fast, personal reply.
Step 5: Monitor Overall Funnel Health
Check these three things daily:
- Connections — are new prospects accepting at a healthy rate?
- Messages — is the sequence delivering without errors?
- Replies — are conversations starting?
Sudden drops in any of these usually point to a specific issue: LinkedIn rate limits, a weak message step, or a targeting problem.
💡 Tip: Consistent daily activity is a better signal than any single day's spike. Look for trends over 7–14 days, not just yesterday.
What's Next
- Campaign Benchmarks — see the exact numbers that define a healthy campaign in SalesMind AI
- Managing an Agent — adjust your agent's daily limits if activity looks too high or too low
- AI Reply Classifications — learn how to act on each tag to move conversations forward