Benchmarks give you a clear pass/fail signal for each stage of your outreach funnel. Use these numbers to spot problems early and know when a campaign is genuinely performing well.
1. Acceptance Rate
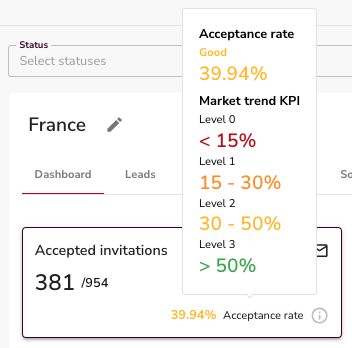
What it measures: The percentage of connection requests that get accepted.
Check this in week one. It's your earliest signal that targeting and profile are working.
| Rate | What it means |
|---|---|
| Above 30% | Healthy start |
| 20–30% | Acceptable, but test your profile or connection note |
| Below 20% | Something is wrong — fix targeting or profile before scaling |
⚠️ Warning: An acceptance rate below 20% is a red flag. Don't keep sending at volume until you've diagnosed the issue. Common causes: too-broad targeting, a weak profile headline, or a pushy connection note.
2. Reply Rate
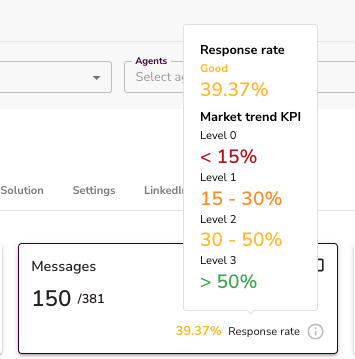
What it measures: The percentage of accepted connections who reply to your messages.
Once your acceptance rate is stable, this is the next number to watch.
| Rate | What it means |
|---|---|
| Above 30% | Strong — focus on qualifying the replies |
| 20–30% | Average — test different opening messages |
| Below 20% | Weak — review your message sequence and value proposition |
💡 Tip: A low reply rate usually means the first message isn't landing. Try a shorter opener, a more specific hook, or a different call to action.
3. Qualification Rate


What it measures: How many replies move into positive AI classification tags (Interested, Researching, Evaluating, Referral, Converted).
A good benchmark is 20–35% of replies landing in positive qualification states.
Watch how tags shift over time. A prospect tagged "Hesitant" today can become "Interested" after a good follow-up. The tags aren't static — they update with every new reply.
👉 Note: Don't ignore neutral or negative tags. "Not Interested" today doesn't mean "not interested forever." A timely, human reply can shift the conversation.
4. Managing High "Not Interested" Rates
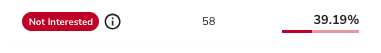
If more than 40–50% of replies are tagged "Not Interested," that's a signal to act:
- Review your message sequence — is the value proposition clear?
- Check your targeting — are you reaching the right personas?
- Reply to every "Not Interested" response. Many prospects change their mind after a genuine, non-pushy follow-up.
💡 Tip: Always reply to every conversation, even negative ones. Unanswered replies leave leads stuck and prevent them from moving into better qualification stages.
5. Meetings and Clients
What to expect when benchmarks are met:
- 3–6 meetings per month per LinkedIn profile
- 1–2 paying clients per month per profile (depending on your sales closing rate)
These numbers assume your acceptance rate, reply rate, and qualification rate are all hitting the targets above. If any stage is underperforming, the output at the bottom of the funnel drops proportionally.
Quick Reference
| Metric | Warning | Target |
|---|---|---|
| Acceptance rate | Below 20% | 30%+ |
| Reply rate | Below 20% | 30%+ |
| Positive qualification | Below 20% | 20–35% of replies |
| "Not Interested" rate | Above 40–50% | Review messaging |
| Meetings per profile/month | — | 3–6 |
| Clients per profile/month | — | 1–2 |
What's Next
- How to Track Outreach Performance — see where to find these numbers inside your Campaign Dashboard
- Managing an Agent — adjust daily limits if your activity volume isn't matching expectations
- AI Reply Classifications — understand every tag and how to act on each one